Category Archives: Market Trends & Indicators

Market trends, leading or lagging indicators. As it relates to industrial property.

Data Center Development – City of Vernon & Los Angeles

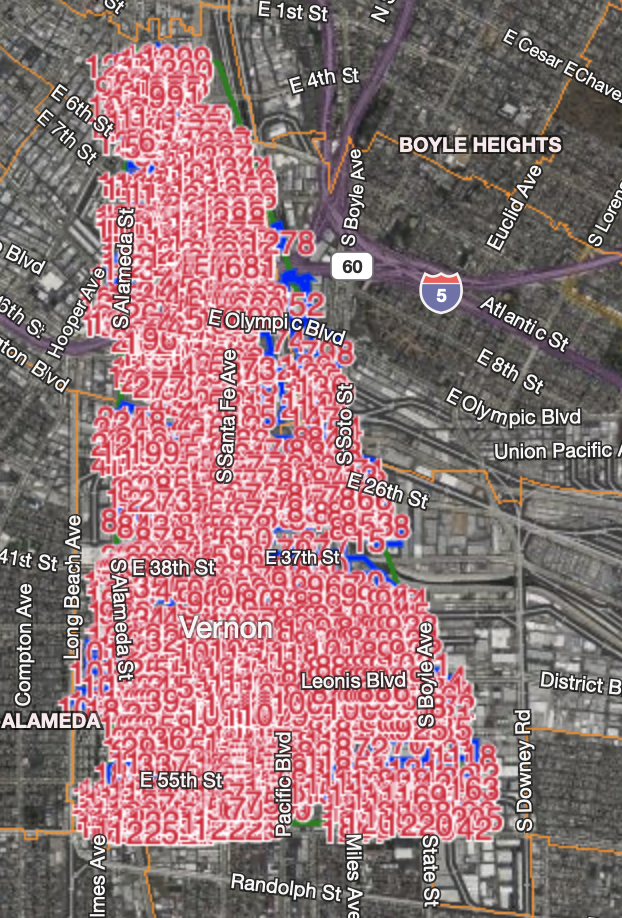
A San Francisco developer has filed plans to build a 261,000-square-foot data center in the Los Angeles County industrial hub – the City of Vernon.

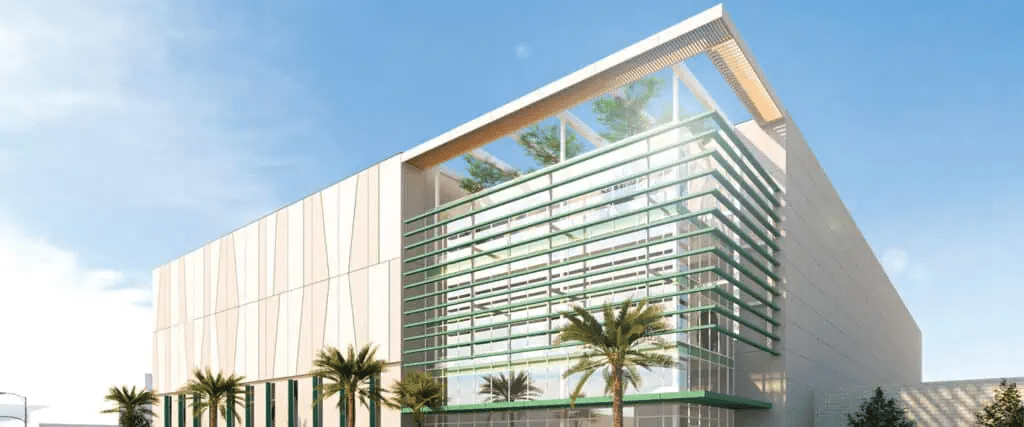
Prime Data Centers, a wholesale data center developer and operator, has proposed a three-story building on 4.5 acres at 4701 S. Santa Fe Ave., five miles south of Downtown Los Angeles, the Los Angeles Business Journal reported.

The first known data center in the industrial city will replace a 224,600-square-foot garment manufacturing facility built in 1946 and last renovated in 2001, according to Dgtl Infra Real Estate. The property was most recently listed for $30 million.

The new data center is expected to deliver up to 33 megawatts of power to its tenants. The company is also creating a 49.5 megavolt amp substation that will service the new site. Completion is expected in the fourth quarter of next year.

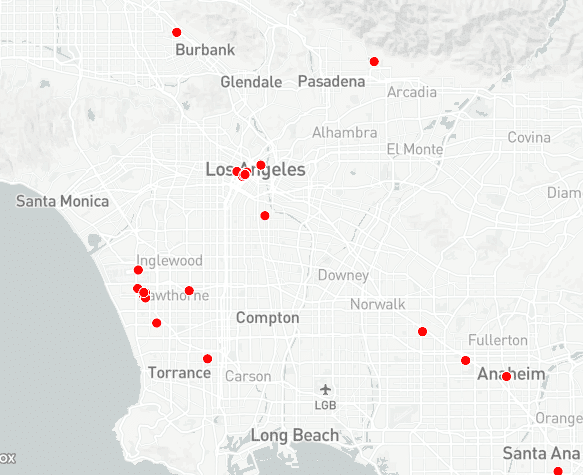
One of Los Angeles’ key strengths is its diverse long-haul fiber and subsea cable connectivity, according to Dgtl Infra. L.A. gives long-haul fiber routes linking Phoenix and Las Vegas access to the West Coast, while serving as a key access point for long-haul fiber routes between Mexico and Canada.

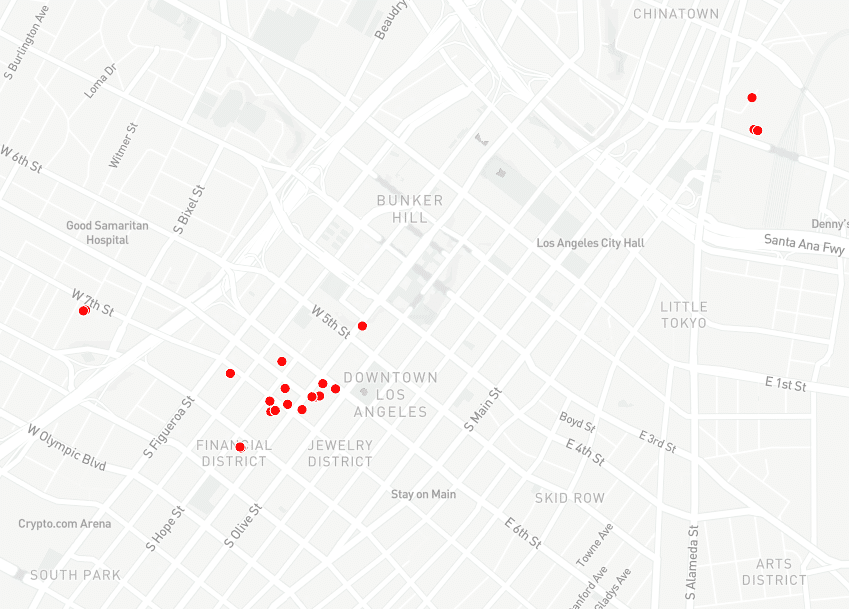
To this end, Prime Data Centers’ Vernon facility will be carrier-neutral and up to five miles away from major interconnection hubs at One Wilshire, 600 W. Seventh St., 530 W. Sixth St., 900 N. Alameda and 818 W. Seventh St. in Downtown Los Angeles, DTLA.

“Los Angeles is a thriving global connectivity market, and our new hyperscale Vernon data center will be right in the middle of it all,” Nicholas Laag, chief executive and founder of Prime Data Centers, said in a statement.

Map of Data Centers in Los Angeles and Southern California.
Map of Data Centers in Downtown Los Angeles.

About Data Centers

The growing reliance on cloud computing and data storage has led to an increased demand for data centers. The two fastest growing segments of the data center space are hyperscalers and edge data centers. Hyperscalers are typically defined as business-critical facilities that are significantly larger than typical data centers and are designed to support robust and scalable applications. These assets are typically owned by companies such as Google, Amazon, Microsoft or Meta. A growth forecast from Data Bridge Market Research indicated that the hyperscale data center market will grow at a CAGR of roughly 29.32% between 2023 and 2035.

Edge data centers are located closer to the users and their devices that collect and transmit data, or wherever data is being generated. Generally, these centers work as the go-between between the cloud or centralized regional data centers and IoT (Internet of Things) devices and their associated cellular tower sites. There is an expectation for IoT devices to grow 16% in 2023 to have an estimated 16.7 billion active end points. This would show a CAGR of 26.1% between 2023 and 2030.

These data center facilities are the hub of the new economy and play a fundamental role in our society and digital economy. Their reliability and growth are critical for the continued development of our economy into Web 3.0.

The rapid growth of emerging technologies like Artificial Intelligence (AI) is fueling demand for data center capacity, already driven higher by the cascade of digital innovations over the past decade such as content streaming, cloud computing, machine learning (ML), Internet of Things (IoT), ecommerce and more. While other commercial real estate sectors are experiencing a decline in construction pipelines, data center development has reached an all-time high and will continue to grow to meet demand. 

Contact us to locate potential sites for development.

California Mandates New Buildings Must Have Solar & Storage

The Golden State currently has the most solar capacity installed in the country, along with an ambitious goal of achieving carbon neutrality by 2045. In keeping with this goal, the California Energy Commission (CEC) has updated the Building Energy Efficiency Standards to promote clean energy adoption statewide. As of January 1, 2023, the California Energy Code requires installing solar power and battery storage for new commercial builds.  

Here’s what you need to know about the new requirements, and how PowerFlex can help you fulfill them.  

Standards For New Commercial Buildings Have Changed 

According to California’s updated Building Energy Efficiency Standards, all newly-constructed commercial buildings (with very select exceptions) must have a solar photovoltaic (PV) array and a battery energy storage system (BESS). This requirement applies to: 

  • Hotels 
  • Office buildings 
  • Clinics 
  • Restaurants 
  • Medical buildings 
  • Retail centers 
  • Grocery stores 
  • Convention centers 
  • Schools 
  • Theaters 
  • Auditoriums 
  • Industrial Warehouse and Manufacturing Factories

The requirement depends on several key facility and locational-based characteristics:  

  • Solar: The minimum required solar will depend on your building type, size, and CA climate zone.  
  • Storage: The minimum required storage (energy and power) will depend both on your minimum required solar system size and a coefficient determined by your applicable CA climate zone.  
  • For example, a 175,000 sq ft single story big box retail store in Fresno, CA would be required to install ~500 kW-DC of solar and a 250 kW/2hr battery storage system* under the new rule. 

Industrial Demand and Dwindling Pandemic Savings


Here is a great summary from the WSJ: Americans built up about $2.1 trillion in excess savings during the pandemic and its immediate aftermath, a cushion for household budgets and a boost for consumer spending. Since August 2021, they’ve drawn down about $1.9 trillion of that. “This implies that there is less than $190 billion of excess savings remaining in the aggregate economy. Should the recent pace of drawdowns persist—for example, at average rates from the past three, six or 12 months—aggregate excess savings would likely be depleted in the third quarter of 2023,” Federal Reserve Bank of San Francisco economists Hamza Abdelrahman and Luiz Oliveira write in a blog post.

The dwindling pandemic savings during 2023 makes me wonder if that is correlated with the dwindling industrial demand that started at the beginning in 2023 and continues here in Los Angeles. Tenant demand for warehouses has fallen sharply this year. Buyer demand has been dampened by the interest rate increases. If the pandemic savings do run out this year then I wonder if consumer spending will follow. If that is the case and consumer spending accounts for about ⅔ of GDP then a slowdown could materialize.

High Land Value As a Percentage of Total Property Value in Los Angeles

In the WSJ article, The U.S. Is Running Out of Land, a professor of finance who studies land values cites that “Land now accounts for 47% of U.S. home values…That is up from 38% in 2012 and less than 20% in the early 1960s.”

So that intrigued me and I pulled a sample of 1,315 industrial zoned parcels from Downtown Los Angeles to the City of Vernon. See below graphic. Dividing the Los Angeles County Assessor Land Value amount by the Total Assessment results in 71% of these industrial properties’ value is the land component. The Total Assessment includes improvements such as warehouse and manufacturing buildings constructed on the land.

That is a strikingly high percentage for land value but should not be surprising given the rapid increase in prices per square foot for land sales in the last decade. In the top section of the graphic, which is the DTLA Arts District, land values have ranged from $300-450/SF in recent years. In the bottom section, City of Vernon land was not long ago $50-100/SF and is now approaching $200/SF.

The Central Los Angeles Industrial Market has been an Infill Market for many years which has resulted in rapid increases in land values. If you own land in this area feel free to contact us.

Understanding Current Economic Inflation

If you want to have a thorough understanding of the causes for the current economic inflation, then this is the best article I’ve read on the subject recently. Christopher Thornberg of Beacon Economics has an excellent grasp of the details. Surprisingly the cause is not primarily supply chain kinks, but rather consumer demand. And Christopher details what has been driving demand and how the Federal Reserve has blundered in managing the money supply in countering inflation.

Below is the linked article.

What the Fed’s Rate Hike Means… and Doesn’t Mean (beaconecon.com)