Investors have showed minimal appetite for commercial mortgage backed securities (CMBS) in recent times with only $10 billion in US CMBS issues in Jan-Apr 2008. Volume is a fraction of the $79 billion in bonds that sold during the first four months of 2007 according to Commercial Mortgage Alert. The general consensus at the Commercial Mortgage Securities Association meeting in New York last week was that an estimated $50 billion of CMBS will be issued in 2009 versus $224 billion in 2007. This volume would put production in line with 2002 levels of $52 billion.
Experts say a likely upswing won’t occur until early 2009 at best at which point CMBS bond prices should be stable enough for investors to jump back in. However, CMBS fundamentals are quite healthy and the delinquency rate is only 0.35%!
As a result of the credit crunch, total commercial real estate transaction volume is off 74% YTD as of April 2008 compared to 2007 levels. Until capital is more readily available transaction volume will likely remain slow.
The 12 month trailing average for capitalization rates in Los Angeles County is five and eight-tenths percent (5.8%) for industrial properties. This rate of return is only a few percentage points higher than competing commercial real estate investments such as retail, multifamily and office. Industrial properties remain to be a clear favorite among sophisticated investors.
In the state of California, the Los Angeles area completed $4.5 billion in commercial property transaction volume while the other major regions of California typically range from $.2 to $1.6 B.
Earlier this month, the six-year-old Alameda Corridor marked a six-digit milestone. The Los Angeles-area intermodal corridor logged the 100,000th train to use the high-speed freight-rail expressway since it opened in April 2002. The 20-mile corridor connects the ports of L.A. and Long Beach with downtown L.A. rail yards and the national rail system. The Alameda Corridor Transportation Authority owns and governs the corridor, which includes a 10-mile, below-ground and triple-tracked mid-corridor trench shared by BNSF Railway Co. and Union Pacific Railroad via trackage rights.
The vacancy rate stands at 2.1% while the availability rate is 5.4%. Both of these figures are slightly higher than a year ago. Los Angeles County is the largest industrial market in the nation, with over 1 billion square feet of industrial land, and the Central Los Angeles submarket maintains the lowest vacancy rate in the nation due to constant user demand for industrial warehousing space. Chicago #2, Dallas/Fort Worth #3, Philadelphia #4, Detroit #5. The five county area of Southern California maintained a three percent vacancy rate.
Investors and users have begun to exhibit cautionary behavior and thus the number of transactions have decreased.
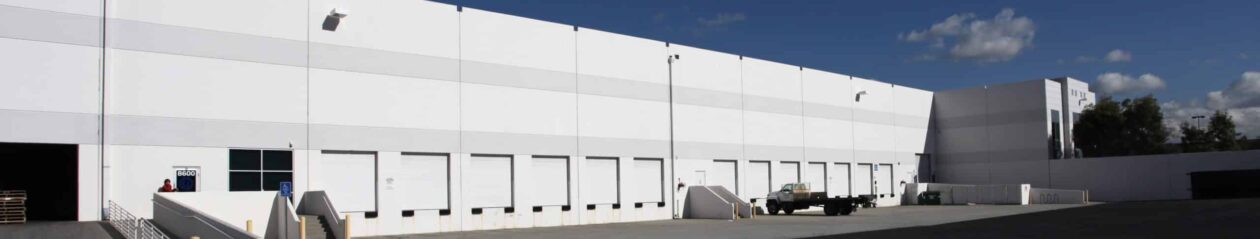
The Central Los Angeles industrial real estate market encompasses approximately 300 million square feet of building area. This market includes the well-known submarkets: City of Vernon, City of Commerce, and Downtown Los Angeles. It should be noted that the following areas on the periphery to Downtown are also included in the Central LA market: Lincoln Heights, Glassell Park, City Terrace, East L.A., Boyle Heights, South Industrial, and the Goodyear Tract. In the Central LA submarket buyer and tenant demand remains strong compared to outlying markets. In fact, the Central submarket remains the tightest metropolitan industrial market in the nation. This submarket is an infill market and very little new construction occurs on empty industrial land (with almost no construction on other types of commercial real estate such as retail and office). The Central LA market is also the largest industrial real estate submarket in Los Angeles County.